 Economic Update Quarterly
Lawry Knopp, VP-Funding & Hedging
Market Summary
Monetary policy and the potential fallout from the Omicron variant are the primary factors driving the market. Investors and traders are considering the prospect of nearly $2 trillion in additional fiscal stimulus while the Federal Reserve begins the process of unwinding monetary stimulus. Fundamentals remain in play with inflation proving to be more persistent than earlier thought while employment and economic growth are projected to continue expanding.
At the Dec. 14-15 Federal Open Market Committee meeting, policymakers announced plans to accelerate tapering its bond-buying program, known as quantitative easing. Asset purchases were reduced to $90 billion for December with directives to Federal Reserve staff to reduce purchases by $30 billion per month until completed, likely in March 2022 provided economic forecasts are realized. The action suggests the Fed may start raising interest rates sooner than later. Fed officials are acknowledging inflation may be more persistent and less transitory than earlier thought. Futures are now indicating a 62% chance the Committee will increase rates by 75 basis points in 2022. The first increase is likely to occur at the May or June meeting, but don’t rule out a March increase. Expect one to two more 25-basis point rate hikes during the second half of the year.
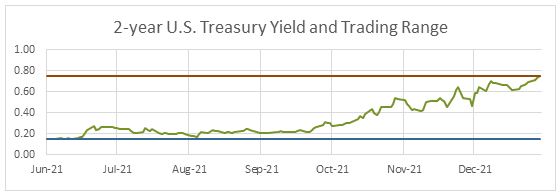
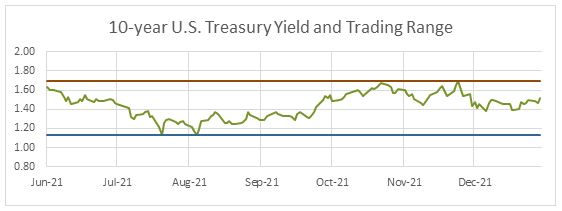
As the Federal Reserve begins tightening monetary policy rates, look for the Treasury yield curve to flatten. The Treasury yield curve graphs U.S. Treasury securities by yield from shortest to longest maturity. The slope of the yield curve (the difference between short-term yields and long-term yields) can be an indicator of future interest rates and economic activity. Since late-June the 2-year Treasury yield is up nearly 50 basis points, increasing from a yield of 0.25% in June to 0.75% a couple days ago. Meanwhile, the 10-year yield is nearly unchanged at about 1.48%. With multiple rate hikes expected for 2022 and 2023 timing will be critical as policymakers seek to slow inflation, which also weakens economic expansion. However, keeping monetary policy too restrictive for too long risks causing the economy to slip into recession.
If the Fed holds short-term rates too high for too long, a yield curve inversion can occur. This is depicted by short-term yields being higher than long-term yields as policy rates remain elevated while the market expects slower growth and increased risk of economic contraction. Yield curve inversions between the 2-year and 10-year Treasury yields have preceded every U.S. recession since 1950, except on two occasions. Although not every inversion foretold a recession. The lag between an inversion and a recession is typically 9-18 months. Watch the yield curve in 2022 for potential signs of an economic soft patch or recession in late-2022 and 2023. The risk of the economy slipping into a recession over the next 12 months is likely around 10%.
In the meantime, Jerome Powell has been nominated for another four-year term as Federal Reserve Chair. In addition, there are three openings on the seven-member board, including the key Vice Chair for Supervision position. As the openings are filled, we may see new banking regulations focused on climate change and efforts to limit financial speculation.
Economic reports remain supportive of continued growth, albeit at a higher level of inflation than earlier thought while economic growth for 2022 moderates somewhat.
- We’ve just closed the books on the fourth quarter and preliminary forecasts project GDP growth of 5%-6%. The market is expecting a 3%-4% increase in economic activity for the first half of 2022. However, the recent surge in the Omicron variant is causing some analysts to downgrade their outlook for U.S. and global growth on fears workers and shoppers will want to stay home to avoid being exposed. Consumer confidence and spending will be key indicators to watch as 2022 gets underway with businesses adapting to ongoing pandemic related shortages, bottlenecks and supply disruptions.
- November's payroll employment rose much less than expected, gaining just over 210,000 versus the 550,000 expected. However, the household survey used to calculate the unemployment rate showed over 1.1 million new jobs. While survey sampling and seasonal adjustments remained challenging and continued to create volatility, the upward trend for jobs remained encouraging. The labor force participation rate increase and substantial gains reported from the household survey were more than enough to make up for the disappointing headline payrolls figure. The market will be looking to see if November jobs get revised higher when the December report is released in early-January. Average hourly earnings decelerated slightly while weekly earnings were higher as hours worked increased. Inflation cut into real earnings, which continues to lose ground despite steady gains on a non-inflation adjusted basis. Overall, this was a solid report despite the headlines. Projections indicate the unemployment rate could move below 4% within a few months, finishing 2022 near 3.5%.
- Consumer inflation for November was down slightly from October. However, year-over-year consumer inflation rose to 6.8%, the highest it’s been since June 1982. Inflation has remained near multi-decade highs longer than anticipated with the impact from higher housing and wage costs yet to be fully realized. Furthermore, supply constraints remain a reality for many businesses. Nevertheless, the market expects consumer prices to move down to the 3%-4% range next year and 2.5%-3.5% for 2023.
On the fiscal policy front, Congress and the Biden administration continue to work on passing legislation to spend almost $2 trillion on social and climate change initiatives over the next 10 years. Democrats are seeking passage of the bill under the process of budget reconciliation, which allows the legislation to be passed with a simple majority vote. Senate committees are working to finalize details of the legislation. Prior to being brought up for a vote the parliamentarian for the Senate must provide guidance on whether various proposals comply with rules on what can be passed under budget reconciliation. In November, Congress passed a $1.2 trillion infrastructure spending bill that was signed into law by President Biden.
Congress recently passed a $2.5 trillion increase in the U.S. debt ceiling, which raised the debt limit to $31.4 trillion. The legislation likely makes room for the U.S. Treasury Department to continue borrowing through the 2022 election cycle.
The CDC’s COVID-19 Data Tracker indicated the 7-day moving average for new COVID-19 cases continues to spike higher, surpassing the surge in July and August. The 7-day moving average is up to 240,408 from a recent low of 64,206 in late-October. The Omicron variant is quickly overtaking the Delta variant as the dominate strain. A month ago, Delta accounted for 99% of new cases. Now, the Omicron variant makes up almost 60% of new cases. While the symptoms of the Omicron variant appear to be milder than Delta, officials are watching the spread of the virus closely.
The total number of fully vaccinated individuals 5 years and older has risen to over 205 million, or 66%. For persons 65 and older, 88% have been fully vaccinated with 58% receiving a booster dose. Despite mask mandates, social distancing requirements and vaccination efforts, the virus continues to spread with the 7-day average for new cases looking like it will soon exceed the January 2021 peak.
Interest Rates Review
| U.S. Treasury Yields |
With the Federal Reserve starting to unwind monetary accommodation the 2-year U.S. Treasury yield has risen to its high levels since March 2020, just prior to lockdowns being implemented due to the coronavirus outbreak. The current yield is near the top of the 6-month trading range of 0.15%-0.75%, which will likely push higher in the coming months as monetary policy transitions from accommodative to restrictive. The top of the trading range may increase to 1.25% by mid-2022. The range for the 10-year Treasury yield is 1.14%-1.69%. As fiscal stimulus efforts by the Biden administration continue and the Fed tightens monetary policy look for the top of the 10-year trading range to increase to about 2.15% within the next several months. If inflation expectations ease, the yield could remain near the middle of the 10-year trading range while signs of persistent higher inflation may push the range higher. |

 |
Economic Highlights
| Economic Growth |
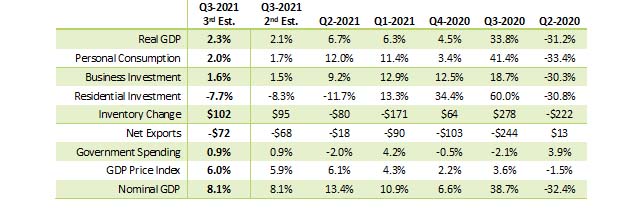
Gross Domestic Product: The final report for the third quarter GDP, which is based on more complete source data, indicated a slight improvement in most categories except for net exports. Overall, the report reveals that real growth, adjusted for the higher inflation seen over the last year, slowed considerably. Preliminary data suggests a moderate acceleration in the current quarter from the weaker third quarter pace. Forecasts call for growth to strengthen on expectations of stronger consumer spending, decent business spending as companies adapt to shortages and restrictions and vaccinations continue to expand. Growth may also get a boost from additional fiscal spending while the drag from tighter monetary policy may not be felt for a few quarters.
|
| Consumer Inflation |
Consumer Price Index: CPI accelerated slightly more than expected in November with the headline year-over-year figure coming in at 6.8%, nearly a 40-year high. Core CPI rose 0.5% on the month, up 4.9% year-over-year to its highest level since June 1991. Owner's Equivalent Rent (OER), a key measure of shelter prices and nearly a third of core CPI, accelerated as expected, up 0.4% on the month. OER historically lags home price movements by over a year, and the acceleration should last until the second quarter of 2022. There is potential for somewhat further acceleration given the historical relationship. Key categories have started to trend higher again. For example, used car and truck prices were up 2.5% on the month. Overall, core inflation pressures remain significant are expected to persist well into 2022.
|
| Employment |
Nonfarm Payrolls: November's payroll employment rose much less than expected, up just over 210,000 versus 550,000 expected, but the household survey used to calculate the unemployment rate showed over 1.1 million new jobs. While survey sampling and seasonal adjustments remained difficult and continued to create volatility, the trend remained impressive, despite the headline miss. Within the payroll survey, retail trade, education and health sector, jobs appeared to be skewed lower by seasonal adjustments. Unemployment Rate: The labor force participation improvement and substantial gains reported from the household survey were more than enough to make up for any one-off disappointment in the headline nonfarm payroll figure. Earnings: Average hourly earnings were higher compared to a year ago while as hours worked increased. However, inflation is pushing real average hourly earnings lower. Overall, this was a decent report notwithstanding the headline.
|
| Monetary Policy |
At the conclusion of the Dec. 14-15 Federal Open Market Committee meeting, policymakers decided to keep the target range for the federal funds rate at 0.00%-0.25%. Fed officials indicated plans to accelerate tapering QE by $30 billion per month, to be finished by March as higher inflation has proven to be more pervasive than expected while the jobless rate approaches full employment. Look for the first hike in policy rates since December 2015 by May or June of next year with one to two additional rate increases by year-end. For 2023, we may see two to four rate hikes, depending on how the economy slows and inflation pressures ease in response to restrictive policy.
The Open Market Desk at the Federal Reserve Bank of New York was further directed to roll over at auction all principal payments from Fed holdings of Treasury securities and reinvest all principal payments from holdings of agency debt and agency MBS. This action keeps past rounds of QE in place. Total securities held on the Fed’s balance sheet amount to $8.6 trillion, consisting of $5.6 trillion in U.S. Treasuries, $2.6 trillion in Agency mortgage-backed securities and $0.4 trillion in repos and loans. |
View on Interest Rates
The Fed is applying the monetary policy brakes as inflation is a growing concern while the economy is nearing full employment. QE will likely be completed by March with the first rate hike since late-2015 occurring in May or June with more rate hikes expected later in the year. Look for the pace of consumer inflation to begin slowing within the next six to nine months while consumers and businesses adapt to shortages, disruptions and the dynamics of the coronavirus pandemic. Inflation metrics are not expected to return to pre-pandemic levels for a few years due to increases in home prices and wage costs.
Look for the 2-year U.S. Treasury yield to climb to the 0.75-1.25% range within a few months depending on how decisively the Fed responds to inflation, employment and GDP reports. The 10-year yield trading range is expected to be 1.5%-2.25% for the next two to three quarters. If the equity markets were to experience a sell off, flight-to-safety trading could push U.S. Treasury yields lower and the dollar higher. Signs of an overheating economy or the inability of the Fed to control inflation would likely send Treasury yields higher.
Impact to Northwest FCS
Northwest FCS has been able to meet customer needs through the challenges of the COVID-19 pandemic and expects to continue doing so as people deal with the dynamics of the virus. The association remains watchful for potential threats that may arise.
Stay up to date
Receive email notifications about Northwest and global and agricultural and economic perspectives, trends, programs, events, webinars and articles.
Subscribe


