Executive Summary
Drivers for the wheat and pulse industry include average yields across the Northwest, elevated costs and an increase in national wheat acres.
- Northwest wheat production and protein levels were consistent with five-year historical averages.
- Cost of production increased in 2022.
- Spring wheat acres increased nationally, encouraged by favorable prices. However, less than ideal weather caused many spring wheat growers to decide between receiving prevent plant insurance payments or planting after recommended cutoff dates to cash in on record prices.
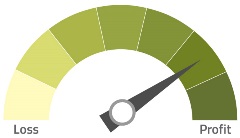
12-Month Profitability Outlook

Northwest FCS’ 12-month outlook anticipates profitable returns for wheat producers. Yields and protein levels are consistent with five-year averages. Rising input costs will drive narrower margins in 2023.
Northwest Situation
Springtime moisture benefited wheat production in the Northwest. Soft wheat protein levels and other measurements were closely aligned with the five-year average. Yields ranged within 10% of historical averages for the majority of producers. Most producers will seed without any trouble.
Montana was the exception, with wheat conditions varying greatly across the state. Areas that received scattered rainstorms may have fields yielding 0-5 bushels per acre growing within a few miles of fields with 30-40 bushels per acre. Compared to the widespread drought in 2021, Montana production improved rapidly with a 50% yearly reduction in acres facing moderate drought or greater.
A sustained period of high wheat prices and considerable insurance payments from 2021-22 crop losses left Northwest growers in a strong revenue position to mitigate rising expenses. While production expenses have declined from mid-summer highs, producers are concerned about input costs for 2023. Diesel prices decreased for 14 consecutive weeks until Sept. 22, declining by nearly a dollar. The decline in prices is partially attributed to short term policies that opened U.S. strategic oil reserves, flooding the market with 1 million additional barrels of oil every day. This policy is set to end in November and the short-lived decrease in gas prices leaves the future of diesel and fertilizer prices uncertain.
Pulses
Pulse production and yields for the 2022-23 crop rebounded from a small crop last year but remain below five-year averages. In 2021, pulse crop yields plummeted, suffering from drought. While lingering drought and mass flooding impacted some areas of the Northwest, growing conditions were more favorable improving pulse crop yields. Yields for dry peas and lentils were up 24% year over year. Garbanzo yields had the strongest come back at 1,122 lbs. per acre, a 307 lbs. per acre increase. Even with yield improvements, pulse crop production is more than 100,000 tons below normal. While production has not returned to historic averages, prices are encouraging and slow to decline from 2021 highs. Favorable prices coupled with yield improvements are benefiting pulse growers.
National
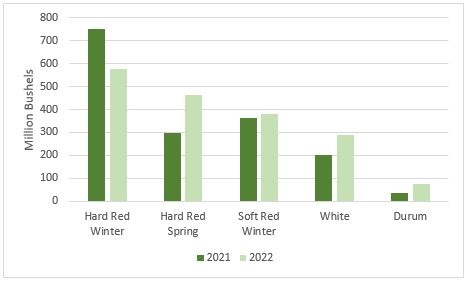
Nationally, wheat production is forecast 8.3% higher year over year. Lower inventory was offset by higher domestic production and more imports, forecasted up 15.8% year over year. Production in 2022 varied by class. Hard red winter production decreased year over year. Record heat and lack of rain in the Great Plains degraded hard red winter yields and crop conditions. For all other wheat classes (hard red spring, soft red winter, white and durum) production increased. Considerable annual reductions in drought conditions across the Northwest and Northern Great Plains improved soft white and durum wheat production.
2022 Wheat Production by Class
Source: World Agriculutural Supply and Demand Estimates, Sept. 12, 2022
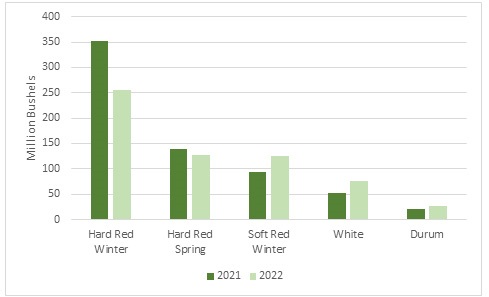
Higher use of hard red winter wheat and a smaller crop lowered the 2022-23 end stocks by 27.5% from last year. Hard red winter and hard red spring wheat ending stocks decreases, down 110 million bushels from 2021 end stocks. Production improvements were
the primary driver for increased soft red winter, white and durum wheat end stocks, up 60 million bushels year over year. National wheat end stocks were 610 million bushels, down 50 million bushels from 2021.
2022 Wheat Ending Stocks by Class
Source: World Agricultural Supply and Demand Estimates, Sept. 12, 2022
According to the USDA grain stocks report, all wheat inventory on Sept. 1, 2022 totaled 1.78 billion bushels, a less than 1% change from a year ago.
On-farm stocks are estimated at 591 million bushels, up 50% from Sept. 1, 2021. Off-farm stocks, at 1.18 billion bushels, are down 13%. The June-August 2022 total use was 534 million bushels, down 24% from the same period last year.
Prevent Plant Decisions
In September 2021, national winter wheat production was expected to increase due to strong prices and favorable insurance payments for growers affected by drought. Producers planted an additional 358,000 acres of winter wheat. Wheat prices continued to increase with futures market price surges in March following the start of the war in Ukraine. Many producers decided to capture higher prices and increased their spring wheat acreage in early 2022.
Unfavorable spring weather made it difficult for some producers to plant spring wheat by the final planting deadlines for crop insurance. Producers had two options, receive a payment for acres that were prevented from being planted (often called prevent plant) or plant after the deadline with less insurance guarantees. More than 6% of all spring wheat acres were reported as prevent plant, a 128% increase from the 10-year average. For Idaho, 8% of spring wheat acres were prevent plant, double the five-year average.
However, the number of prevent plant acres was lower than Risk Management Agency (RMA) anticipated. By the time insurance deadlines were nearing (between April 15 and May 31 for Northwest spring wheat) futures prices were higher than insurance payments (averaging $8.89 per bushel). Many producers decided to replant after the final insurance planting dates, believing higher prices would outweigh losses from lower yields.
World Outlook
The global wheat outlook for 2022-23 forecasts increased supplies, higher consumption, more trade and higher ending stocks. World supplies were raised to 1,059.6 million metric tons (MMT) due to increased production in Russia and Ukraine. Russia is forecasted to have record wheat production of 91.0 MMT, an increase of 3 MMT from initial forecasts. Projections for Ukrainian wheat have been revised to show an additional 1 MMT of wheat, but production estimates remain below average, down 38% from the 2021-22 crop due to the ongoing war.
Russia is the largest wheat exporting country accounting for 20% of global wheat trades. The anticipated Russian bumper crop will likely dominate global trade, putting pressure on European wheat trades. In mid-September, Russian Black Sea wheat was selling for $20 to $30 per ton less than European wheat. It is likely that Russia will use their competitive price advantage and larger crop to increase their global export market share. A strengthening U.S. dollar coupled with elevated wheat prices will hamper U.S. exports and increase trade competition for wheat.
On Sept. 14, 2022, the U.S. and Taiwan signed an agreement to increase exports to Taiwan by 70 million bushels within two years. Taiwan is currently the 6th largest wheat export destination for the U.S. This agreement would increase trade by an estimated $576 million dollars annually and increase total U.S. wheat exports by 8.8%.
Share your feedback! Click Here to complete a two-minute survey about this Snapshot
Additional Information
Northwest FCS Business Management Center
NWFCS Industry Insights
CME Group
www.cmegroup.com
Columbia Grain
www.columbiagrain.com
Columbia River Pilots
www.colrip.com
GrainNet News
www.grainnet.com
Kansas State Ag Manager Grain Marketing
www.agmanager.info/grain-marketing
Merchants Exchange of Portland, Oregon
www.pdxmex.com
Minneapolis Grain Exchange
www.mgex.com
National Grain and Feed Association
www.ngfa.org
Pacific Northwest Grain and Feed Association
www.pnwgfa.org
Port of Portland
www.portofportland.com/
U.S. Wheat Associates
www.uswheat.org
USDA – U.S. Department of Agriculture
www.usda.gov
USDA National Agricultural Statistics Service
www.nass.usda.gov/Publications
USDA Weekly Weather and Crop Bulletin
www.usda.gov/sites/default/files/documents/wwcb.pdf
USDA World Agricultural Supply and Demand Estimates
www.usda.gov/oce/commodity/wasde/index.htm
World-Grain
www.world-grain.com
World Malting Barley Report
www.e-malt.com
Learn More
For more information or to share your thoughts and opinions, contact the Business Management Center at 866.552.9193 or bmc@northwestfcs.com
To receive email notifications about Northwest and global agricultural and economic perspectives, trends, programs, events, webinars and articles, visit www.northwestfcs.com/subscribe or contact the Business Management Center.
Stay up to date
Receive email notifications about Northwest and global and agricultural and economic perspectives, trends, programs, events, webinars and articles.
Subscribe