 Economic Update Quarterly
Lawry Knopp, VP-Funding & Hedging
Market Summary
U.S. monetary policy has been the primary market driver over the past several months. The market is also being confronted with higher levels of equity market volatility, developments related to the war in Ukraine as it moves from invasion to occupation and increased uncertainty in the global economic growth outlook. Meanwhile, inflation data has yet to show meaningful signs of slowing and is pressuring consumer confidence and spending.
At the conclusion of the June 14-15 Federal Open Market Committee meeting, Federal Reserve officials announced a 75 basis point increase in the main policy rate, the largest increase since 1994, which raised the federal funds rate target range to 1.50%-1.75%. Based on the level of inflation, comments in the post-meeting statement and press conference, and recent speeches by Fed officials, the market expects a rate hike of 75 basis points at the July 26-27 FOMC meeting with a potential 50 basis point increase at the September FOMC meeting. Futures also indicate possible rate hikes of 25-50 basis points for the November and December meetings.
Federal Reserve Chairman, Jerome Powell indicated the Committee wants to raise policy rates to a restrictive stance this year in support of its goal of reducing inflation to a sustainable 2% level and bringing demand in better balance with supply. Comments during the press conference suggested policy would favor bringing down inflation over maintaining low unemployment. Market indications suggest the fed funds target range could increase to 3.5%-3.75% by year-end with more rate hikes possible in 2023, if deemed necessary. Furthermore, the committee indicated it will continue reducing the Fed’s investment holdings of Treasury and agency securities by $47.5 billion per month, increasing to $95 billion in September.
By raising interest rates and embarking on quantitative tightening economic growth is expected to weaken, as consumer spending slows and unemployment likely increases. If policy remains too restrictive for too long, the result can be a vicious economic cycle of even weaker demand, slower spending and higher unemployment, which weakens demand further. Fed officials also acknowledge returning price stability to the economy will likely require action by other forces beyond the control of monetary policy, which includes alleviating supply chain disruptions and shortages due to geopolitical turmoil and fallout from the COVID-19 pandemic.
Interest rates have moved significantly higher, the major equity markets have fallen, and inflation remains a key concern. Despite the increase in interest rates, the Fed believes the economy is in a strong position and will be able to withstand a higher interest rate environment. However, not all analysts agree with the Fed’s outlook and are concerned the economy will experience some degree of a “hard landing” as the Fed tightens monetary policy.
For now, the Fed seems fairly determined on its path of tighter policy to get inflation under control. While the unemployment rate is 3.6%, near a 40-year low, overall inflation is running at 8.6% compared to a year ago, and financial conditions have deteriorated with Q1-2022 GDP growth contracting 1.6% and the S&P-500 index down about 20% year to date. Credit markets continue to function with decent availability of liquidity and demand from investors despite credit spreads having widened over the past couple months. Events that could push the Fed to alter course include a sustained rise in unemployment, another quarter of negative economic growth, a significant disruption in credit markets, an even sharper sell off in the equity markets or increased geopolitical turmoil.
Central banks around the globe are following Fed policy with rate hikes of their own in an effort to tame runaway inflation after arguing for months that price increases were transitory. The Bank of England and Swiss National Bank increased rates shortly after the Fed announced its rate increase. The European Central Bank is expected to soon increase rates for the first time since 2011. Look for a 25 basis point increase followed by a potential 50 basis point increase in September. The ECB’s challenges are more complex compared to other developed economies as it must ensure policy is effectively implemented across the entire euro area. So far, the Bank of Japan continues to maintain its ultra-easy monetary policy, which is somewhat unexpected and has resulted in greater pressure on the yen as the currency continued to weaken.
Interest Rates Review
| U.S. Treasury Yields | The two-year U.S. Treasury yield has risen to levels not seen since 2007. The current yield is near the top of the six-month trading range of 0.73%-3.33%. The current level of the two-year yield indicates the market is anticipating several more rate hikes by the Fed. The current spread between the two-year and 10-year Treasury yields is around 15 basis points. In early April, the Treasury curve was inverted by 7 basis points. 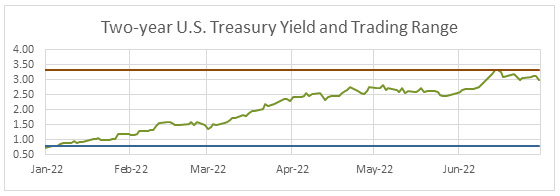 |
The six-month trading range for the 10-year Treasury yield is 1.50%-3.39%. While inflation remains high, some see recession risks rising. Look for limited change in the range unless there are strong indications the Fed will become much more aggressive in its efforts to bring down inflation. If signs of a much weaker growth and slower inflation outlook begin to form, longer-term yields could decline, possibly resulting in an inverted yield curve if the Fed is slow to respond. 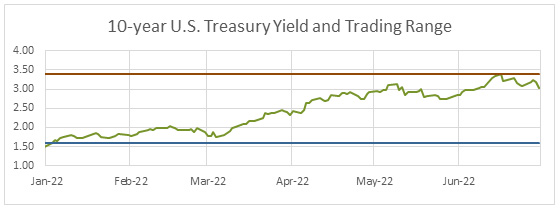 |
Economic Highlights
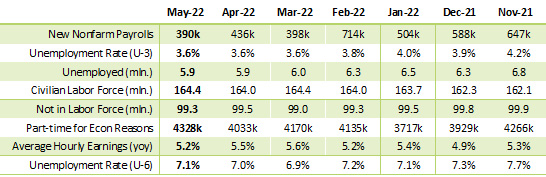
| Employment | The employment report from the Bureau of Labor Statistics comes from two surveys. The establishment survey reports data related to nonfarm payrolls and earnings. The household survey collects employment and labor force data and is the source for calculating the unemployment rate. Nonfarm Payrolls: The 390k increase in jobs for May exceeded market expectations while revisions to March and April were mixed. Gains were broad-based, with hiring in leisure and hospitality, professional and business services, and transportation and warehousing sectors leading the way. Declines in retail trade employment, which includes general merchandise, clothing and clothing accessories stores, bears watching and may be signaling some belt tightening on the part of shoppers or a greater shift to online shopping due to record high gas prices. Manufacturing job growth slowed but remained positive. Government jobs expanded by 57k while private sector jobs increased 333k.
Earnings: Average hourly earnings compared to a year ago remain strong. However, prices are rising faster than wages resulting in negative growth in real average hourly earnings. Overall, the report suggests demand for labor remains strong, which supports the prospect for more rate hikes by the Federal Reserve this year and possibly next year. Keep in mind, the unemployment rate is a lagging indicator, whereas the Weekly Jobless Claims Report can be a leading indicator. Weekly Initial Jobless Claims are up from a low of 166k in mid-March to 231k last week. While the level of claims remains relatively low, keep an eye on the trend. Claims approaching 300k and higher will likely signal trouble ahead for the labor sector. |
| Economic Growth | Gross Domestic Product: The “third” estimate of U.S. economic growth by the Bureau of Economic Analysis indicated Q1-2022 real gross domestic product contracted down 1.6%, which was slightly worse than the “second” estimate of a 1.5% decrease. The update is based on more complete source data than was available for the “second” estimate. Growth in consumer spending was revised lower while business spending expanded. Residential investment growth has slowed but remains positive for the quarter. Inventories were less of a drag on growth while the revision to net exports and government spending was limited.
The data indicates the economy was losing momentum as the quarter ended, which supports the case for a potential negative GDP print for Q2 and possible start of a recession within the next two to four quarters. Nevertheless, forecasters and Federal Reserve officials continue to expect the economy to avoid a recession as monetary policy moves to a restrictive stance and the economy contends with:
|
| Consumer Inflation | Consumer Price Index: Year-over-year CPI increased to 8.6% for May, the fastest rate of inflation since December 1981. Food prices are up 9.7% while the price of gas is up nearly 50%. The rate of core inflation declined to 6% from 6.2% last month. The jump in inflation is being fueled by the lagged impact of supply and demand imbalances generated by the COVID-19 outbreak and massive monetary and fiscal policy response. The Russian-Ukraine war further exacerbated the supply chain disruptions. On a month-over-month basis the CPI increased 1% with food prices up 1.1% while prices for gasoline rose by 4.1%. Core inflation, which excludes food and energy increased by 0.6% with gains in housing (0.6%), new vehicles (1.0%), used cars and trucks (1.8%) and medical (0.4%). 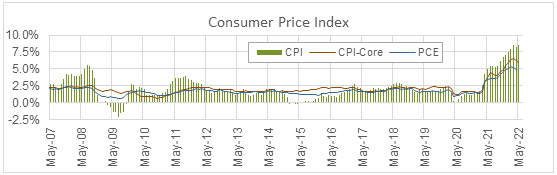
With West Texas Intermediate crude oil trading in a range of $90-$124 per barrel since mid-February, look for continued pressure on headline inflation. Overall, core inflation pressures remain significant due to persistent supply chain problems and higher housing prices and wage costs, which has been further complicated by energy market turmoil from the Russian invasion of Ukraine. We may not see headline year-over-year inflation drop below 4% until mid-2023. |
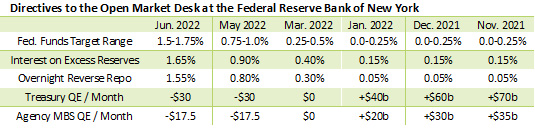
| Monetary Policy | The table below summarizes recent decisions regarding monetary policy implementation by the Federal Open Market Committee meeting. The next FOMC meeting is July 26-27. Subsequent FOMC meetings are scheduled for Sept. 20-21, Nov. 1-2 and Dec. 13-14.
The Open Market Desk at the Federal Reserve Bank of New York is currently operating under a directive to roll over at auction all principal payments from Fed holdings of Treasury securities and reinvest all principal payments from holdings of agency debt and agency MBS. This action keeps past rounds of QE in place. |

View on Interest Rates
The Fed is fully engaged in its efforts to slow the rate of inflation while escalating sanctions on Russia complicate the inflation and global growth outlook. Look for rates hikes and quantitative tightening to continue until there are indications inflation is on a solid downtrend, which may not occur for 6-12 months. The Fed will likely tolerate more weakness in the equity markets, but signs of friction in the credit markets or a sharp increase in unemployment could cause the Fed to reassess the pace of rate hikes.
Look for the two-year U.S. Treasury yield trading range to be 3%-3.65% for the next several months depending on how decisively the Fed responds to inflation, employment and GDP reports. The 10-year yield trading range is expected to also be 3%-3.65% for the next two to three quarters as the curve remains relatively flat. The trading ranges will be sensitive to the economy’s response to monetary policy.
Stay up to date
Receive email notifications about Northwest and global and agricultural and economic perspectives, trends, programs, events, webinars and articles.
Subscribe