Executive Summary
Drivers for the hay industry include improvements in yields for later cuttings, lower national inventories and competitive demand for dairy quality hay.
- Heavy rains affected quality and yields for first cutting hay in the Northwest. Quality and yield improved substantially in later cuttings, although many areas will have one or two fewer cuttings than normal.
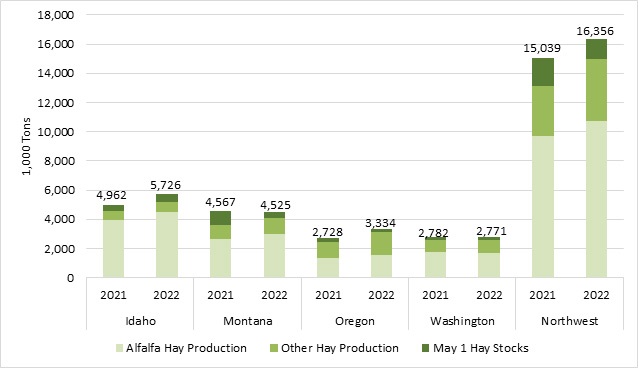
- Total hay production in the Northwest increased by 1.3 million tons from 2021, however hay supplies will likely remain tight due to lower starting inventories.
- Competition from domestic dairies and exporters for premium quality hay has supported elevated prices. Tight supplies have limited hay sales with dairies struggling to find hay for purchases.
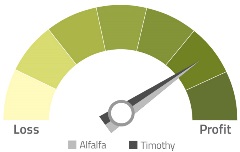
12-Month Profitability Outlook

Northwest Farm Credit’s 12-month outlook for the hay industry suggests profitable returns. Strong demand, limited supplies and high prices will support profitability for alfalfa and timothy hay growers. Hay growers who did not have enough production to support their operations will face challenges finding hay available for purchase.
Northwest Situation
National hay supplies (2022-23 crop and inventory carry-overs) decreased by 3.4% year over year. Supplies are down due to reductions in national production and smaller hay carry-overs from the 2021 crop. Both the alfalfa and grass hay crop are forecasted lower. Alfalfa production decreased by 3.4 million tons (MT) to 116.8MT, a 0.3% annual decline, and grass hay production fell 4.6%. These losses result in a smaller national hay crop, down 2.9% from 2021-22. On-farm hay inventories also took a hit. On-farm hay stocks as of May 1, a measure of hay carried over from the previous crop, fell 6.9% year over year.
Improvements in weather have provided relief through modest increases to the Northwest hay supply. On Sept. 27, 2021, 83% of Northwest fields were rated as poor or very poor condition. A year later, this number fell to 42%. With the overall improvement in field conditions, hay production increased by 14.1% in Idaho, 13.3% in Montana, 27.2% in Oregon and 1.1% in Washington year over year.
Hay carry-overs from 2021 were tight in the Northwest with May 1 on-farm hay stocks down 510,000 tons, 27% less than in 2021. These reductions in carry-overs kept total hay supply for Montana and Washington’s lower than 2021, despite production increases. Northwest’s total hay supply grew to 16.4 million tons, up 1.3 million tons of hay. Despite improvements, hay supply will remain tight into 2023. It is unlikely that producers will be able to rebuild depleted feed inventories.
Northwest Total Hay Supply, 2021 vs 2022

Source: USDA AMS, Compiled by Northwest FCS.
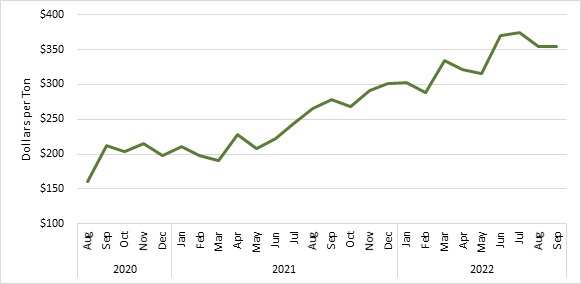
In Montana, increased hay production (up 13.3% from 2021) was not enough to fully offset the reduction in beginning hay inventories. Delays in first cuttings combined with excessive heat and little rain during the summer have left hay supplies at critically low levels. A second year of hay shortages has kept prices elevated; premium quality hay is selling at $250 per ton and higher, more than double normal hay prices. Low inventory and high prices have producers buying the bare minimum (if they can find hay to purchase) and delaying rebuilding feed inventories by another year.
In Washington, first cutting alfalfa was devastated by rain. Tight initial inventory, combined with poor quality for first cutting hay, placed a $300 per ton price floor on feeder quality hay. Excess rain and cold weather increased disease and pest pressures. Weather and hay conditions improved for the second and third cuttings, supported by a strong demand and elevated prices. Most producers in Washington will only get four cuttings. Even with the improvements in production for later cuttings, the total hay supplies for Washington are forecasted to be similar to 2021’s hay supply due to low initial hay inventory.
In Idaho, cold weather and untimely rains delayed first cutting, limiting most hay growers in the Magic Valley to only three hay cuttings. Excessive summer heat has bolstered yields and Idaho’s total hay production increased 644,000 tons from 2021, up 14.1%. However, the heat has reduced overall quality, with most hay unable to pass tests needed for dairy quality. Trade slowed at the end of September, softening hay prices.
In Oregon, instances of rain and cold weather delayed planting and damaged first cuttings. Second cutting alfalfa had better yield and quality, with feeder quality hay selling around $300 per ton. Depending on rain, some producers are optimistic they might get a fourth cutting, but most will finish with only three cuttings. Orchard grass is being shipped to California dairies for $400 per ton.
Northwest Premium Alfalfa Price

Source:USDA AMS, Compiled by Northwest FCS.
Dairy
July and August saw strong competition between dairies and exporters for premium quality hay. The competitive pressure came to a stalemate in September as dairies and exporters are assessing the current market in hopes of waiting out high prices. The slowdown in export quality trades has steadied and cooled hay prices. Dairy quality hay in Central Idaho fell by $20 per ton, but overall prices remain elevated. Challenges with getting hay to meet dairy quality tests support elevated prices for premium or higher quality hay. Dairies have resorted to changing feed rations to include less alfalfa, although finding affordable alternatives is difficult as prices are elevated for most forages.
Cattle
Of the four largest cattle producing states (Texas, Oklahoma, Missouri and Nebraska respectively), all face significant droughts that depleted hay production. These states, especially the Southern Plains region, have liquidated cattle herds due to higher feed costs and difficulties securing hay. The reduction in the national cattle herd will likely take two to three years to rebuild, softening the domestic demand for feeder quality hay in the near term.
The Northwest has also seen a reduction in cattle herd size. Idaho, Montana, Oregon and Washington have collectively decreased their herds by 252,000 cows in the last five years, averaging a 2.3% decrease in herd size annually.
Exports
A strengthening U.S. dollar and rising exchange rates pose risk for hay exporters. Of the three largest hay export destinations, all have had exchange rate increases. The Chinese Yen exchange rate has increased to $7.12 Yen for $1 USD on Sept. 29, 2022, up 10.1% from a year ago. The Japanese Yen reached $144.61 Yen for $1 USD, a 29.6% yearly increase, and the South Korean Won exchange was up 16.8% from last year.
Hay exporters must manage the compounding effects of higher prices and exchange rate increases. Export quality hay in the Columbia Basin is trading at over $135 per ton more than a year ago. When also factoring in exchange rates, the real cost of exported hay to Japan has doubled within a year. Shipping rates, particularly from East Asia to North America, will provide some price relief, falling nearly 60% below their September 2021 peaks. Despite the increase in hay prices, all three major Asian export destinations increased alfalfa exports. Higher exchange rates coupled with record hay prices have led to a slower hay export movement, but hay export demand remains relatively elastic with total alfalfa and grass exports decreasing only 1.1% year over year.
U.S. Alfalfa Exports (January-July)
.jpg?sfvrsn=96274361_0&MaxWidth=800&MaxHeight=&ScaleUp=false&Quality=High&Method=ResizeFitToAreaArguments&Signature=62E9FDF81E6F6583218CB7C5DC9DC18C386AF998)
Source: U.S. Census Bureau. Sept. 8, 2022.
U.S. Grass Exports (January-July)
.jpg?sfvrsn=44b8f6f2_0&MaxWidth=800&MaxHeight=&ScaleUp=false&Quality=High&Method=ResizeFitToAreaArguments&Signature=33C4880D30BBF9365D979AC8E76B5878B86B8923)
Source: U.S. Census Bureau. Supt. 8, 2022.
Alfalfa Guidelines for Domestic Livestock Use and Not More Than 10% Grass

*Relative Feed Value calculated using the Wisconsin/Minnesota formula. **Total Digestible Nutrients calculated using the Western formula. Quantitative factors are approximate; many factors can affect feeding value. Values are based on 100% dry matter. Guidelines are to be used with visual appearance and intent of sale (usage).
Source: USDA Agricultural Marketing Service.
Share your feedback! Click Here to complete a two-minute survey about this Snapshot.
Additional Information
Northwest FCS Business Management Center
www.northwestfcs.com/Resources/IndustryInsights
Hay & Forage Grower
www.hayandforage.com
USDA Livestock and Grain Market News
https://www.ams.usda.gov/market-news
Progressive Forage
www.progressiveforage.com
USDA Hay Reports
https://www.ams.usda.gov/market-news/hay-reports
Australian Fodder Industry Association
https://www.afia.org.au/
The Hoyt Report
http://thehoytreport.com
Learn More
For more information or to share your thoughts and opinions, contact the Business Management Center at 866.552.9193 or bmc@northwestfcs.com.
To receive email notifications about Northwest and global agricultural and economic perspectives, trends, programs, events, webinars and articles, visit www.northwestfcs.com/subscribe or contact the Business Management Center.
Stay up to date
Receive email notifications about Northwest and global and agricultural and economic perspectives, trends, programs, events, webinars and articles.
Subscribe